Tag Archive for: Localized Illumination

To analyze the tubulin dynamics during spindle formation, Drosophila S2 cells were transfected with mEos2-labled tubulin. By local irradiation with UV laser light (405nm) the green fluorescent mEos2 photoconverts to a red fluorescent dye. In contrast to photobleaching, where the fluorescent signal is locally depleted, the photoswitching allowed the independent observation of two different tubulin fractions in space and time.


Movie1: Photoconversion of mEos2-labeled tubulin in the spindle of a Drosophila S2 cell. The video is sped up 20-fold from real time.

Setup:

  • Microscope: Standard widefield microscope
  • Objective: 100x NA 1.4
  • 405 & 473 nm diode laser

Rapp OptoElectronic Components:

  • UGA-40 – point scanning device (integrated in µ-manager)


Data taken from:
Kurt’s Microscopy Blog
http://nic.ucsf.edu/blog/2014/04/photobleaching-and-photoactivation/

Kurt Thorn (1) & Nico Stuurman (2)

(1) Nikon Imaging Center (NIC) at University of California – San Francisco (UCSF)
(2) Vale Lab at University of California – San Francisco (UCSF)

Channelrhodopsin-2 is a cation channel derived from algae that will open with millisecond precision upon illumination with blue light (excitation maximum around 470 nm) and depolarize neuronal membranes. This can be used to selectively activate neurons and neuronal fibers expressing this protein, replacing the need for unspecific extracellular electric stimulation. In a pilot study, we used this channel in combination with the Rapp OptoElectronic UGA-40 system to map inputs to pyramidal cells in the hippocampus.

Figure 1: Panel A shows 23 illumination locations set using the sequence stimulation function of the UGA-40 and an extracellular recording electrode placed in the stratus radiatum. Panel B shows an overlay of extracellular field potentials in response to 5 ms illumination at each point.

Setup:

  • Upright microscope for electrophysiology

Rapp OptoElectronic Components:

  • UGA-40 – point scanning device
  • DL-473 – 473nm diode laser


Data provided by:

Dr. Ole Paulsen & Dr. Michael Kohl

The Neuronal Oscillations Group – Department of Physiology at University of Oxford (Oxford, United Kingdom)

As a proof of concept, experiments in acute brain slices were performed to characterize the uncaging efficiency of caged calcium in response to localized UV irradiation. By using Fluo4 as an indicator for Read more

Mouse embryonic fibroblasts (MEF) were transfected with different mutations of the adaptor protein vinculin and FRAP experiments were performed to analyze the influence of the mutations on the incorporation of vinculin into focal adhesions (FAs).

For the quantification of the real protein exchange dynamics within focal adhesions without overlying cytosolic diffusion artifacts, the FRAP technique was combined with TIRF (total internal reflection fluorescence) microscopy. To this end, a Zeiss Observer Z.1 (TIRF) microscope was equipped with a Rapp OptoElectronic fixed spot illumination device coupled to a 473 nm diode laser (DL-473). In combination with a 100x objective, a spot size of approximately 5 µm in diameter was illuminated, allowing bleaching of single focal adhesions in living cells. The results indicate a slight, but significant increase in mobile fraction for the Y1065E-mutant and an uncoordinated incorporation of the Y1065F-mutant into FAs.

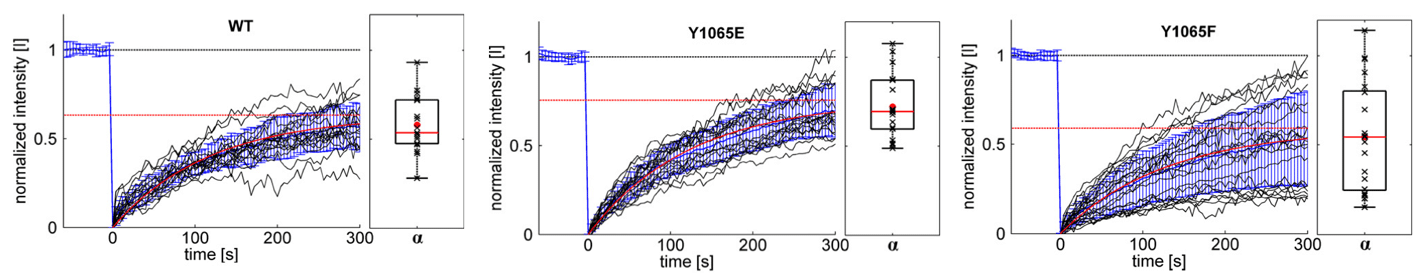
Figure 1: Exchange dynamics of different vinculin constructs measured with a TIRF-FRAP setup. Different eGFP-vinculin constructs (WT, Y1065E and Y1065F) were expressed in vin‑/‑ MEFs. Before bleaching, cells were monitored for at least 5 minutes to ensure that only stable FAs were analyzed. Black graphs show the normalized intensity [I] curves from individual measurements. The mean value and its standard deviation σ are shown in blue; results from the fit of mean values to the kinetic model are shown in red. The saturation value α indicates the mobile fraction (red dotted line). At the right of each graph, the box plots show the distribution of the mobile fractions of single measurements (black “x”). The mean values are given as a red dot, the median as a red line.


Setup:

  • Microscope: Zeiss Observer Z.1 with TIRF
  • Objective: 100x α-Plan-Apochromat (oil) NA 1.46

Rapp OptoElectronic components:

  • FRAP System: ZSI fixed spot illumination
  • Light source: DL-473 diode laser
  • Optical fiber: multimode (ø = 550 µm) => spot size on sample approx. 5 µm


Published:

Küpper at al. 2010. “Tyrosine Phosphorylation of Vinculin at Position 1065 Modifies Focal Adhesion Dynamics and Cell Tractions.” Biochemical and Biophysical Research Communications 399 (4): 560–64. doi:10.1016/j.bbrc.2010.07.110.

Hippocampal slices of P16 mice were stained with the cell-permeant calcium-sensitive dye Fluo-4 AM and additionally loaded with
Read more